This post is intended to help sales agents convert a statement with rows and columns of data into something that can be used to learn how to work smarter.
Click on this example file if you would like to follow along on your own computer.
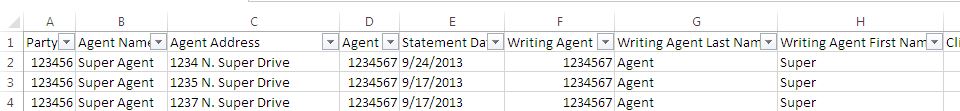
One great and easy to use tool is Filter. To use this tool select one of the cells in the top row of your data. Next click on the Data tab at the top of the screen. Next click on the Filter button in about the middle of the ribbon. Your top row should now look like this.
By clicking on those little gray squares with the triangles you can do lots of useful things. You can sort the data into alphabetical order by Member Name or into chronological order by statement date. An even more useful feature is being able to filter down to just the information you want to see.
You may notice when you try to sort this data by date that things don’t seem to work out right. That is because Excel isn’t recognizing the dates as dates. It sees them as simple text. To fix this let’s add a column to the right of our data. In Column AB type “Statement Date 2″. Remember that when you add a new column you need to toggle the filter off and on. Otherwise the new data won’t sort with the old. In cell AB2 type “=datevalue(” then click on cell E2 and hit enter. Now select the date you just selected. In the bottom right corner of the cell you will see a little square. If you double click that square it will copy the formula down the rest of the page. You now have a column that will let you sort by date. (for practice you can do the same for the Policy Eff Date column)
Since I am running out of time to write this blog and I plan to cover these points in a class let me make a list of the other points I want to cover.
How to create a pivot table from the data
How to use conditional formatting to make certain data points pop out
How to Create a pivot chart to see progress over time.
If you’d like to see what it looks like at the end
here is an updated version